 Anytime of the day when you go out into the streets, there is a greater chance that you will spot a runner. Running as a sport, became popular when U.S. won the first Olympic gold medal in 1972 marathon. More and more people are taking up running and are participating in different races including; 5K, 10K, Half marathon, and Full marathons.
 Analyzing the runner's data from Chicago Marathon and using Tableau Software, I was able to answer the following questions:
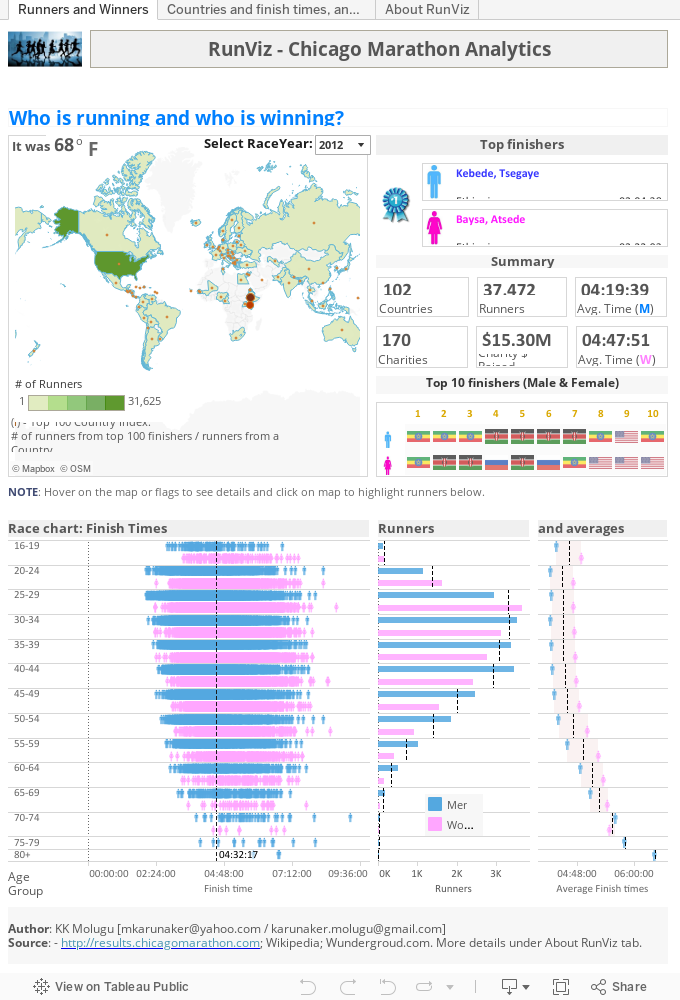
- Who is running and who is winning?
- Countries participation and winners?
- Ideal temperature for runners?
Enjoy RunViz! and thanks for your voting!
RunViz - Winner of Tableau User Group Contest !
Nicely done, KK. Rich with information, nicely formatted, good use of space and color.
ReplyDeleteData by itself is nothing without appropriate analysis like what you have here. This is neat and to the point. Great job, KK.
ReplyDelete